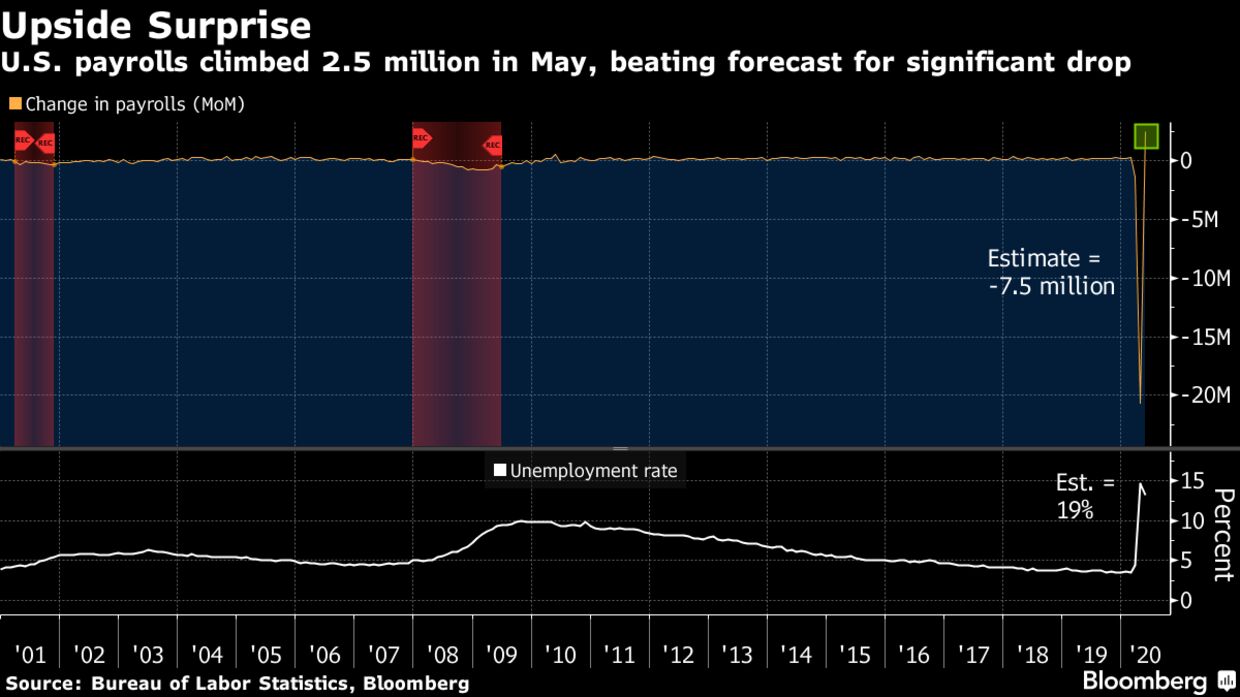
Gold in US-Dollar, weekly chart as of May 26th, 2020. Source: Tradingview
Technical Analysis: Gold in US-Dollars
On the weekly chart, gold bulls continue to strive to finally leave the uptrend channel that began in August 2018 behind them. So far, they have not yet succeeded in doing so. Should the bulls now run out of steam or do need a breather, a quick pullback towards the mid of the trend channel would be very likely. However, despite weeks of consolidation at a high levels, there is still no sign of exhaustion. But one could speak of a "dwindling bullish momentum".
It is noticeable that since the beginning of the year gold has been moving primarily in the zone between the 61.8% fibonacci retracements (US$1,586) and the 78.6% fibonacci retracements (US$1,733). These fibonacci retracements relate to the major correction in the gold market when prices fell from US$1,920 down to US$1,045 between 2011 and 2015. Since the final low in December 2015, the bulls have now recovered 61.8% and 78.6% of the lost distance.
Hence, the zone between US$1,586 and US$1,733 is the last place of refuge for the gold bears. If this last bastion can be sustainably conquered, the way to the all-time high at US$1,920 and prices above US$2,000 would be clear. From this perspective alone, the confusing back and forth over the last few weeks is therefore not surprising. At the same time the bears obviously do not (yet) have enough strength to wrest larger space from the bulls here.
Weekly chart is overbought and could take quite some time until being oversold
However, the stochastic oscillator does not look good on the weekly chart. Both lines are still bullishly embedded above 80, but as soon as the momentum starts to turn, the strongly overbought position immediately will kick in and deliver a sell-signal. In that case a multi-weeks to multi-months corrective phase becomes extremely likely. This is in line with our title Gold – Patience is A Virtue.
All in all, gold prices have been treading water for weeks now and seem to be slightly stuck above US$1,700. However, a trend reversal has not happened. Ideally, the slightly disjointed picture will dissolve with a healthy but overall manageable pullback in the summer months. Alternatively this pullback is already happening….
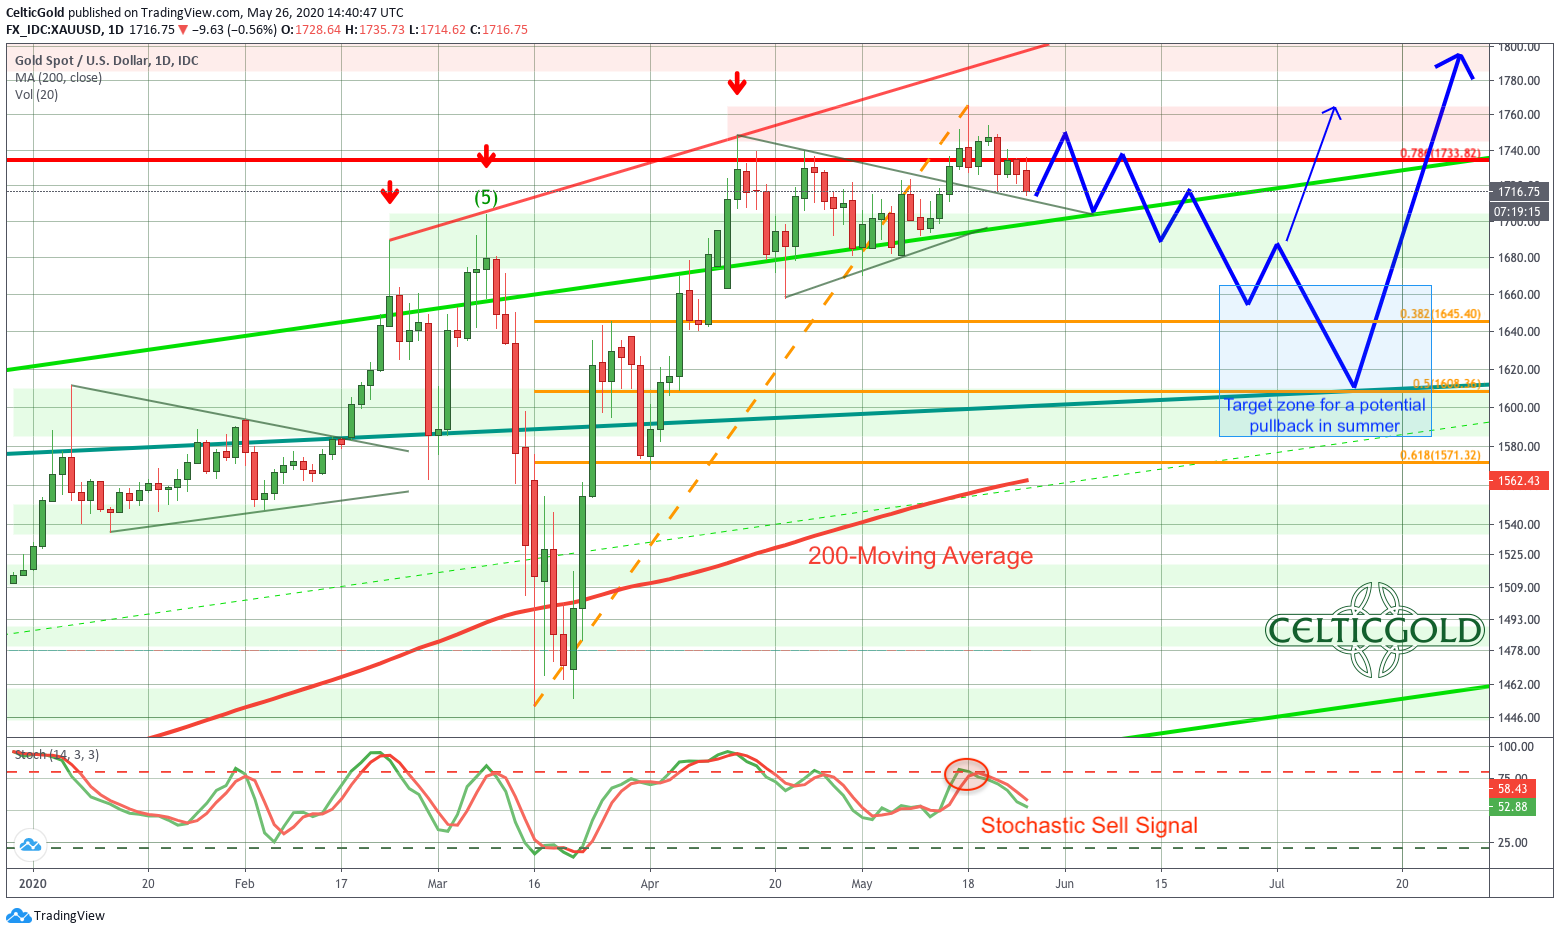
Gold in US-Dollar, daily chart as of May 26th, 2020. Source: Tradingview
On the daily chart, the bulls managed to break out of the five-week consolidation triangle on May 14. With the following spike towards US$1,765 they immediately made it clear who is in charge. In the meantime, however, this actually bullish breakout has already come to an end without any sustained gains, as prices have been falling rather rapidly from US$1,765 down to US$1,698.
Now bulls will have to answer with a bounce and a compelling recovery. However, prices above US$1,730/1,735 might already cause difficulties. Nevertheless, the chances of another wave up into the range between US$1,745 and US$1,765 are pretty good. Especially as the stochastic oscillator he has cooled down considerably on the daily chart and move in the neutral zone. This setup would once again provide enough room for another bullish run.
Silver is still in rally mode and will play more catch up rather soon
Furthermore, the silver price, which had just begun to move two weeks ago, does not appear to have reached the end of its rally yet. Rather, silver could pull the price of gold up again for the next few weeks.
In summary, the daily chart is neutral after weeks of consolidation. Similar to last spring and last autumn, gold prices managed to work off the heavily overbought situation without major losses but only with mild declines. Thus, at least in the short term, there is once again the chance of a rise towards the highs of US$1,765 on the chart. Even a new high at US$1,800 can not be ruled out.